Real estate recruiting trends in 2026: expectations vs. reality
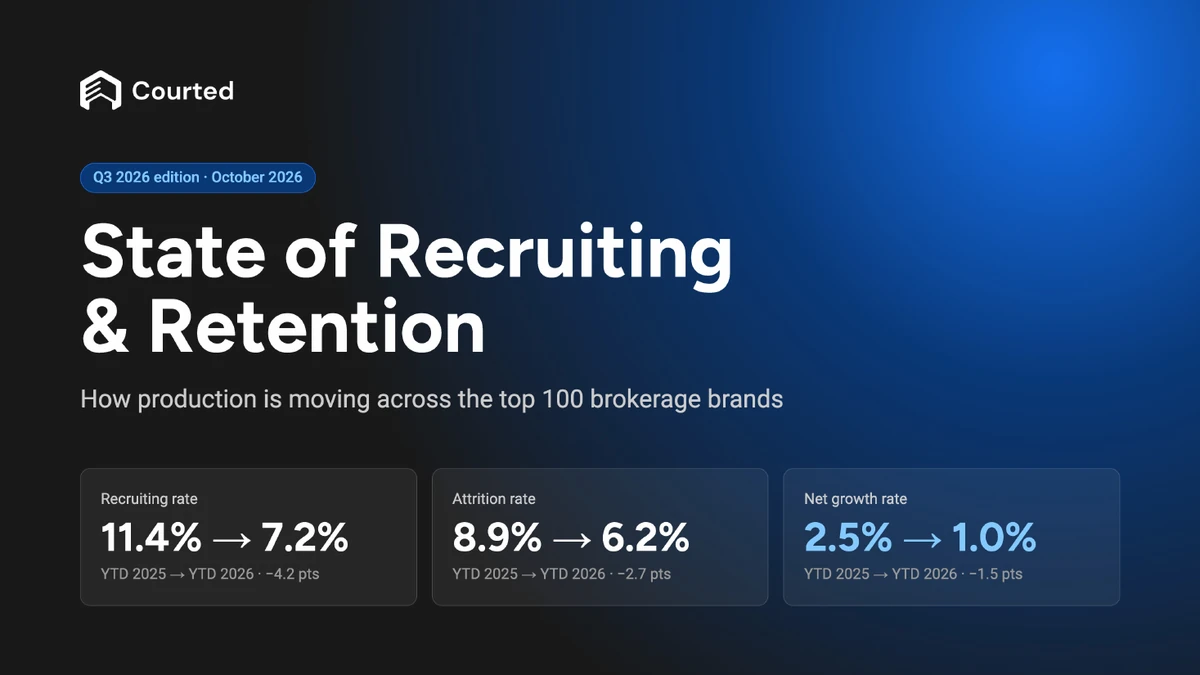
Real estate recruiting cooled far more in 2026 than most of the industry expected. From January to September, the top 100 brokerage brands netted $24.3 billion in production through recruiting, down 57% from $56.6 billion in the same months of 2025. Retention held up better: most brands lost a smaller share of their production to departures.
Those are the headline real estate recruiting trends in Courted's State of Recruiting & Retention data for 2026 through Q3. The data measures the sales volume of agents who joined or left each of the 100 largest brokerage brands, so it tracks production, not just headcount.
How did real estate recruiting trends compare with expectations in 2026?
Recruiting came in well below expectations. In October 2026, Courted co-founder and CEO Sean Soderstrom asked his LinkedIn network how the top 100 brands' net recruiting gains changed from January to September, compared with the same months of 2025. About two-thirds said flat or up. None chose "down more than 50%," the answer that matched the data.
The miss matters because recruiting is watched closely. In a spring 2025 Inman Intel survey of brokerage leaders, 42% named recruiting and retention their top challenge.
"Most of the industry expected recruiting to hold steady this year. The data says the market cooled more than people felt it," Soderstrom said.
Here's the expectation next to what happened, and how the main numbers moved.
Expectations vs. reality
Brokerage recruiting in 2026
Top 100 brokerage brands, January to September 2026 vs. the same months of 2025
What people expected
Flat or up
About two-thirds of LinkedIn poll respondents said net recruiting gains held steady or grew. None chose “down more than 50%.”
What happened
−57%
Net production gained through recruiting fell from $56.6 billion to $24.3 billion.
By the numbers
| Top 100 brands | 2025 | 2026 | Change |
|---|---|---|---|
| Production | |||
| Volume recruited | $257.1B | $176.6B | −31% |
| Volume lost | $200.5B | $152.3B | −24% |
| Net volume gained | +$56.6B | +$24.3B | −57% |
| Recruiting, attrition and net growth rates, as a share of total annual volume across the top 100 | |||
| Recruiting rate | 11.4% | 7.2% | −4.2 pts |
| Attrition rate | 8.9% | 6.2% | −2.7 pts |
| Net growth rate | +2.5% | +1.0% | −1.5 pts |
| Brands | |||
| Brands with net growth | 81 | 68 | −13 |
How much did real estate recruiting slow in 2026?
The top 100 brands recruited $176.6 billion in production from January to September 2026, down 31% from $257.1 billion a year earlier. Production lost to departing agents fell less, by 24%, from $200.5 billion to $152.3 billion.
As a share of the top 100's combined annual sales volume, the recruiting rate fell from 11.4% to 7.2%. The attrition rate fell from 8.9% to 6.2%. Net growth is the gap between those two rates, and it narrowed from 2.5% to 1.0%.
A 1.5-point drop may sound small, but it’s over half of the net production the top 100 gained a year earlier. Fewer brands are growing, too: 68 of the top 100 added net production, down from 81.
Is agent retention getting better or worse?
Retention is getting better, and broadly. Of the 95 brands in the top 100 both years, 73 lost a smaller share of their production to departing agents than a year earlier. The median brand's attrition rate fell from 6.3% to 4.7% of its annual sales volume.
Among the 25 largest brands, the three with the lowest attrition lost only 3.0% to 3.7% of their volume.
Fewer brokerages see retention as their biggest problem, too. In the 2025 Profile of Real Estate Firms from the National Association of REALTORS® (NAR), 18% of firms named agent retention their biggest challenge for the next two years, down from 22% in 2023, according to NAR's analysis of the survey.
"Retention is the bright spot. About three in four brokerages are keeping more of their production than they did last year," Soderstrom said. Retention gains carry into next year, too. Here's why agent retention compounds over time.
For what pushes agents to leave in the first place, see why real estate agents switch brokerages.
Do the brokerages that recruit the most grow the most?
They still grow fastest, but they also lose the most, and that gap widened in 2026. The quarter of brands with the highest recruiting rates lost 10.0% of their volume to departures. That's 2.8 times the 3.6% lost by the quarter that recruited least, up from 2.0 times a year earlier.
After departures, the heaviest recruiters kept about 31 cents of every dollar of production they recruited, down from 41 cents.

"Recruiting gets the headlines, but the brands that recruit the most also lose the most. The ones pulling ahead have a focus on retention," Soderstrom said. Headcount alone can mislead, too. Here's why more agents doesn't mean more production.
Which brokerages are growing fastest in 2026?
Mid-size and regional brands are growing fastest. Brands ranked 26 to 100 added 2.3% to 2.7% of their annual sales volume through net recruiting, while the 25 largest added 0.7% to 0.9%. Every size tier still grew.
Brands ranked 11 to 25 slowed the most, from 4.05% net growth to 0.90%.

How should brokerages recruit real estate agents in Q4 2026 and in 2027?
Recruit for net production, not headcount. In 2026, the brands that recruited hardest also lost the most, so what a brokerage keeps after departures decides how much recruiting adds.
- Create organizational focus on recruiting. Ensure managers have dedicated time to proactively recruit, including daily routines, executive oversight and accountability, and incentives to hit net volume goals. Proactive outbound agent recruiting is required to win in this market environment.
- Track your net growth rate. Take the production you recruited, subtract the production you lost, and divide by your annual sales volume. A brokerage with $500 million in annual volume that recruits $40 million and loses $30 million over the same period has a net growth rate of 2%. For the top 100 combined, that rate fell from 2.5% to 1.0%.
- Treat retention as part of recruiting. Every agent you keep is production you don't have to replace. Recognize milestones, like a first listing at your brokerage, and watch for early signs an agent may be thinking about a move, like a drop in activity.
- Focus on the agents most likely to move. With less production changing hands, a list of top producers isn't a plan. Use predictive signals on which agents may move to decide where to spend your time.
- Benchmark against brands your size. The 10 largest brands grew 0.69% from January to September and brands ranked 51 to 100 grew 2.30%, so compare yourself with your peer group, not the industry as a whole.
- Select the right software to turbocharge growth. Homegrown systems are easy to set up. However, the true time and costs associated with building and maintaining your own MLS-integrated systems are often underestimated. Well-established growth platforms like Courted allow brokerages to double down on recruiting and match their existing workflows and processes.
How should brokerage leaders choose recruiting software for growth?
Choose software that shows both sides of growth: who you can recruit and who you might lose. Look for five things in one system:
- Production data on every agent in your market. It should come from the MLS and refresh often. Tools without their own data mean importing lists that go stale.
- Signals on which agents may move. With less production changing hands, a list of top producers isn't a plan, because most of them won't move this year.
- A recruiting pipeline. Track each recruit's stage, last conversation and next follow-up, so nothing depends on one recruiter's memory.
- Personalized outreach. Agents tune out mass recruiting emails. AI drafts help only when they use each agent's real production, and your team should be able to edit every draft.
- Retention alerts on your own agents. The brands that recruited the most this year also lost the most. Alerts on milestones, like a first listing at your brokerage, and warning signs, like 90 days without activity, prompt managers to reach out early.
Courted Talent Solutions includes all five in one system, with ComposeAI drafting outreach from each agent's production. For a full checklist and the questions to ask in a demo, see how to choose real estate recruiting software.
Book a demo to see which agents in your market may be ready to move.
Frequently asked questions
What are the biggest real estate recruiting trends in 2026?
Recruiting slowed more than expected while retention improved. From January to September 2026, net production the top 100 brokerage brands gained through recruiting fell 57%, to $24.3 billion. Volume recruited fell 31% and volume lost fell 24%. Mid-size and regional brands grew fastest, and 73 of the 95 brands in the top 100 both years lost a smaller share of their production to departures, according to Courted's data.
What is a good agent attrition rate for a brokerage?
Measured by production, the median top 100 brokerage brand lost 4.7% of its annual sales volume to departing agents over the first nine months of 2026, down from 6.3% in the same months of 2025. Among the 25 largest brands, the three with the lowest attrition lost 3.0% to 3.7%. An attrition rate below your peer group's median is a sign of a durable brokerage.
How do you measure net recruiting growth?
Net recruiting growth is the production a brokerage recruits minus the production it loses to departing agents, divided by its annual sales volume. Measuring production instead of agent count shows what each move is worth. For the top 100 brokerage brands combined, the net growth rate fell from 2.5% in January to September 2025 to 1.0% in the same months of 2026.
How can brokerages recruit real estate agents in 2026?
Recruit for net production, not headcount. Focus outreach on productive agents who show signs they may move, pair every recruiting push with a plan to keep your current agents, and track the production you keep after departures. In 2026, the brands that recruited the most also lost the most, so retention decides how much recruiting actually adds.
How should brokerage leaders choose real estate recruiting software for growth?
Choose software that shows both who you can recruit and who you might lose. Look for production data on every agent in your market, signals on which agents may move, a recruiting pipeline, personalized outreach and retention alerts on your own agents. Courted Talent Solutions includes all of these in one system, so a brokerage can manage net growth instead of recruiting wins alone.
What is the best real estate recruiting software for agent retention?
The best recruiting software for retention alerts managers when their own agents reach milestones worth recognizing or show changes that suggest they may be considering a move, and prompts them to reach out. Software that handles recruiting and retention in one place lets a brokerage see net growth, not just new recruits. Courted Talent Solutions includes both.
How does your brokerage compare?
"Every brokerage leader wants to know how they stack up against their peers. We're happy to show any brand how it compares with its cohort," Soderstrom said.
Courted can show how your brokerage's recruiting, attrition and net growth rates compare with brands your size. Request a demo to see how your brokerage compares with its peers.
About this data: Courted's State of Recruiting & Retention compares January to September 2026 with the same months of 2025, for the top 100 brokerage brands by sales volume in each period. Production recruited and lost is the sales volume of agents who joined or left each brand, and net production is the difference. Rates divide that production by each brand's annual sales volume, so both years share one base. Retention comparisons use the 95 brands in the top 100 both years. Recruiting quarters split the top 100 into four equal groups by recruiting rate in each period. Expectations come from Soderstrom's October 2026 LinkedIn poll. Figures for July to September may firm up slightly as late moves are recorded.